Five months into 2026, the S&P 500 continues to paint a picture of a highly selective bull market. While the index itself sits near record highs, the gains have not been evenly distributed. Instead, investors have aggressively rewarded specific industries tied to artificial intelligence, infrastructure spending and cyclical economic resilience, while punishing sectors facing slower growth, structural challenges or valuation concerns.
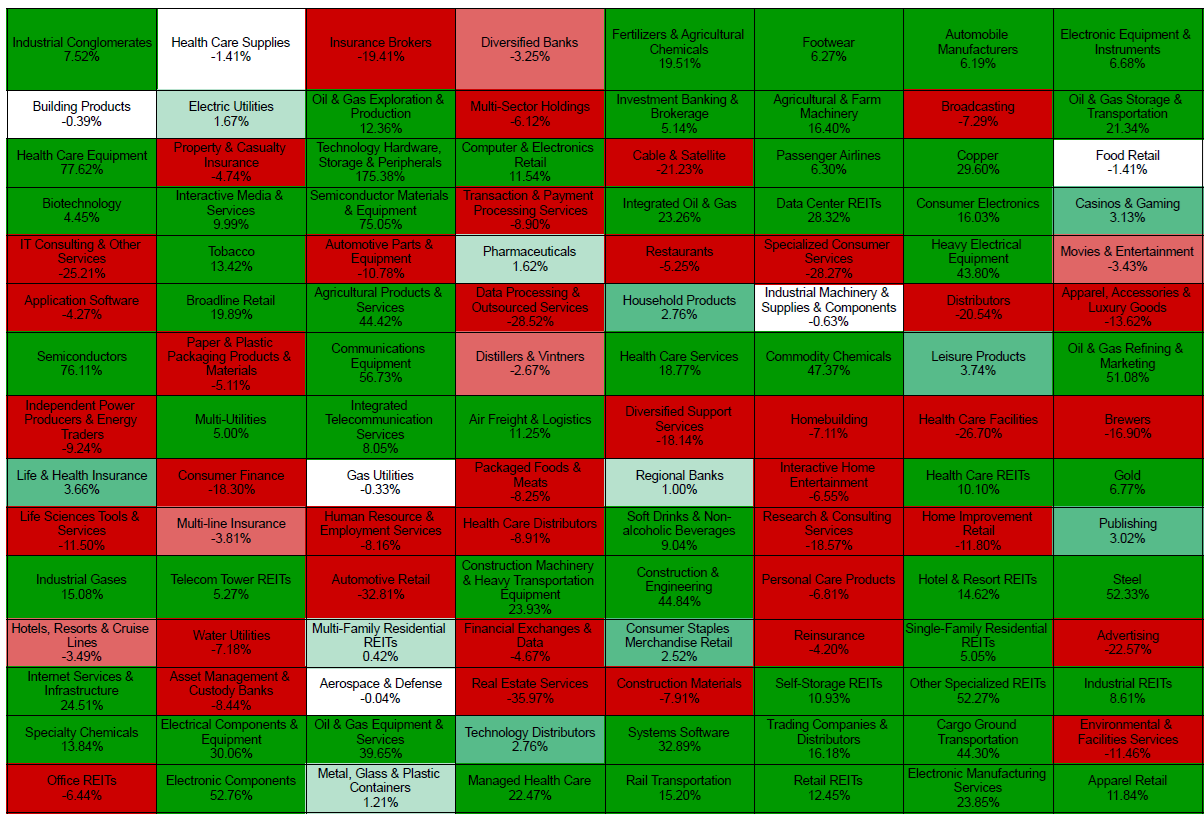
The latest RUMMU GICS Sub-Industry heatmap reveals one of the widest performance dispersions seen across the market in recent years.
At the top of the leaderboard sits Technology Hardware, Storage & Peripherals with an extraordinary175.3%. Followed by Semiconductors, up a huge 76.1% year-to-date. The sector remains the clearest beneficiary of the ongoing AI boom, with demand for advanced computing, data centre infrastructure and next-generation chips continuing to exceed expectations. Closely linked industries have enjoyed similar strength, including Electronic Components (+52.7%), Semiconductor Materials & Equipment (+75.0%), Communications Equipment (+56.7%) and Systems Software (+32.9%).
The rally extends well beyond chips. , with Data Center REITs surging 28.3%. Investors continue to reward businesses positioned at the centre of digital transformation, cloud infrastructure and enterprise software spending.
Energy has also delivered some surprising winners. Oil & Gas Storage & Transportation gained 21.3%, while Integrated Oil & Gas has climbed 23.3% and Oil & Gas Refining & Marketing is up 51.1%. These moves suggest investors remain confident that global energy demand will remain in focus with the US-Iran conflict continuing.
Agriculture-related businesses have quietly become one of the strongest performing areas of the market. Fertilizers & Agricultural Chemicals have rallied 19.5%, Agricultural & Farm Machinery has gained 16.4%, and Agricultural Products have advanced 44.4%. These sectors have benefited from improving commodity conditions and continued investment in global food production efficiency.
Consumer-facing industries have also shown remarkable strength. Broadline Retail has surged 19.9%, and Home Furnishings Retail has gained 10.6%,. The performance suggests consumer spending remains healthy in areas, despite ongoing concerns about inflation and interest rates.
Healthcare performance has been far more mixed than many investors might expect. Healthcare Equipment has gained 77.6%, Healthcare Services has advanced 18.8%, and Managed Healthcare has risen 22.5%. However, Biotechnology is up only 4.5%, while Health Care Facilities have fallen 26.7% and Health Care Distributors have dropped 8.9%. Investors have clearly favoured profitable healthcare businesses with durable cash flows over more speculative areas of the sector.
Perhaps the most interesting story within the heatmap is the divergence inside real estate. Data Centre REITs have climbed 28.3% as AI infrastructure demand continues to drive investment into digital capacity. Self-Storage REITs have gained 11.0% and Specialized REITs have advanced 52.3%. Meanwhile, Real Estate Services have collapsed 36.0%, Office REITs are down 6.4%, and Timber REITs are broadly even at -0.08%. Investors are rewarding property sectors linked to long-term structural growth while avoiding areas facing demand uncertainty.
The weakest performers reveal where the market sees the greatest challenges.
Automotive Retail have fallen 32.8%, Data Processing & Outsourced Services is down 28.5%, and Consumer Services has declined 28.3%. Traditional media has struggled, with Broadcasting down 7.3% and Advertising falling 22.6%.
Insurance has emerged as one of the market’s most challenged areas. Insurance Brokers have fallen 19.4%, Reinsurance is down 4.2%, and Multi-Line Insurance has declined 3.8%. Financials more broadly have delivered mixed results, with Investment Banking & Brokerage rising 5.1% while Insurance Brokers have fallen 19.4%.
One of the most striking observations from the heatmap is that leadership has broadened beyond the Magnificent Seven narrative. While semiconductors and AI remain dominant, strength is appearing across industrial technology, agriculture, transportation equipment, specialised healthcare and selected energy infrastructure businesses.
This suggests the 2026 rally is not solely dependent on a handful of mega-cap technology stocks. Instead, investors are increasingly rewarding industries with clear earnings growth, durable demand drivers and strong capital allocation.
The message from the market is clear. Companies exposed to AI infrastructure, industrial modernisation, energy logistics and specialised technology continue to attract capital. Businesses facing slower growth, regulatory pressure or structural disruption are being left behind.
As the S&P 500 pushes deeper into record territory, the performance gap between winners and losers continues to widen. For investors, understanding where capital is flowing may be just as important as understanding the direction of the index itself. The heatmap shows that beneath the surface of a strong market lies a very selective one, where industry positioning remains one of the most important drivers of returns in 2026.