Sector Heatmaps
-
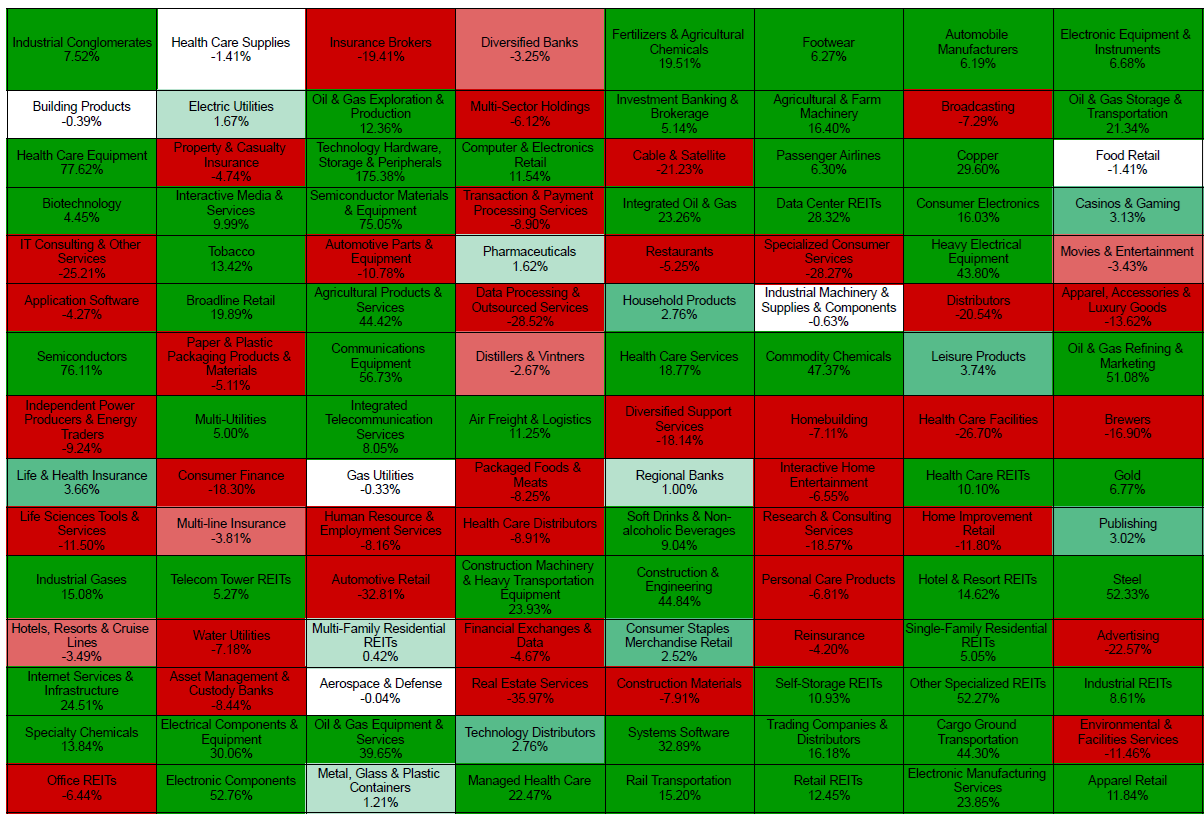
S&P 500 YTD Sector Rotation: AI Winners, Consumer Strength and the Collapse of Defensive Leadership
 Read more: S&P 500 YTD Sector Rotation: AI Winners, Consumer Strength and the Collapse of Defensive Leadership
Five months into 2026, the S&P 500 continues to paint a picture of a highly selective bull market. While the index itself sits near record highs, the gains have not been evenly distributed. Instead, investors have aggressively rewarded specific industries tied to artificial intelligence, infrastructure spending and cyclical economic resilience, while punishing sectors facing slower…
-
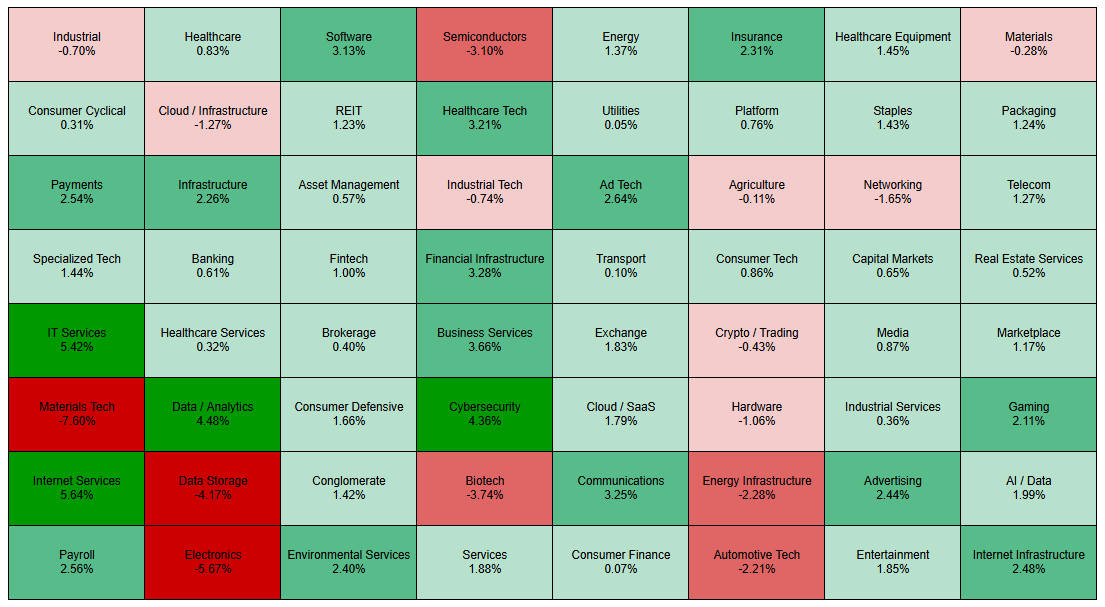
S&P500 Heatmap Week 18th May 2026
 Read more: S&P500 Heatmap Week 18th May 2026
Last week’s S&P 500 action painted a picture of a market that remained constructive at the index level, but with increasingly selective leadership beneath the surface. While the broader benchmark continued to hold near record highs, intraday behaviour suggested investors were rotating aggressively between sectors rather than simply buying the market indiscriminately. Technology remained one…
-
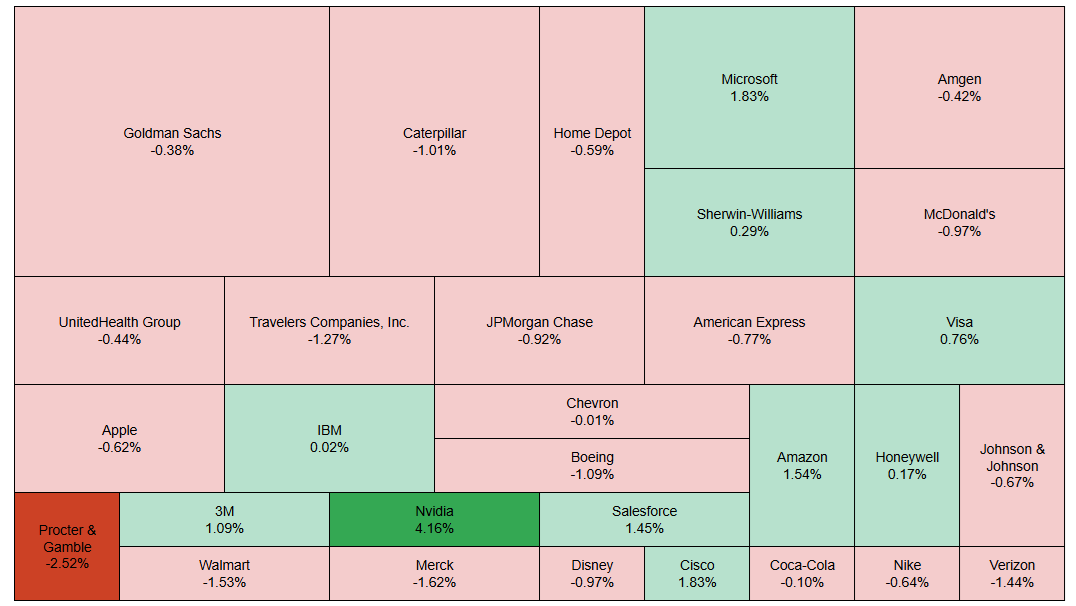
Dow Jones Industrial Average Heat Map 24th April
 Read more: Dow Jones Industrial Average Heat Map 24th April
Markets traded with a relatively contained tone yesterday, but beneath the surface the session reflected a more uneven and selective structure. The Dow Jones Industrial Average finished at 49,230.71, down 79.61 points, or 0.16%, while the intraday move from open to close was slightly weaker at -0.18%, suggesting that pressure persisted throughout the session rather…
-
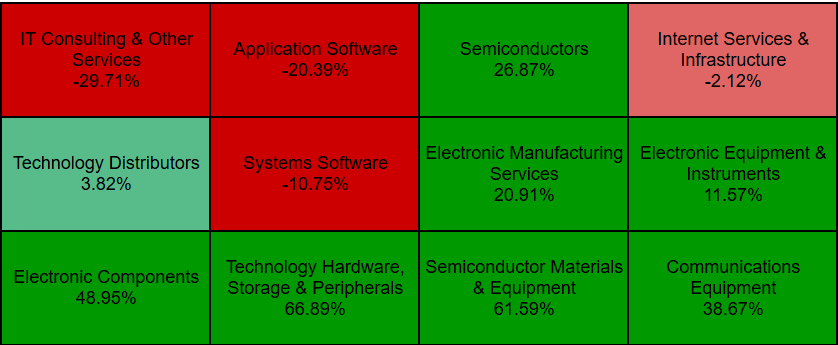
Hardware Leads, Software Lags: The Fragmentation of Tech in 2026
 Read more: Hardware Leads, Software Lags: The Fragmentation of Tech in 2026
At the index level, the technology sector continues to project strength, supported by ongoing enthusiasm around artificial intelligence and infrastructure buildout. However, beneath the surface, performance has become increasingly fragmented, revealing a clear divergence between hardware-linked businesses and software-driven models. Year-to-date returns (22nd April 2026) across the Information Technology sector highlight this split. On one…
-
21st April: Crypto to Fintech Weakness Signals Broader Market De-Risking
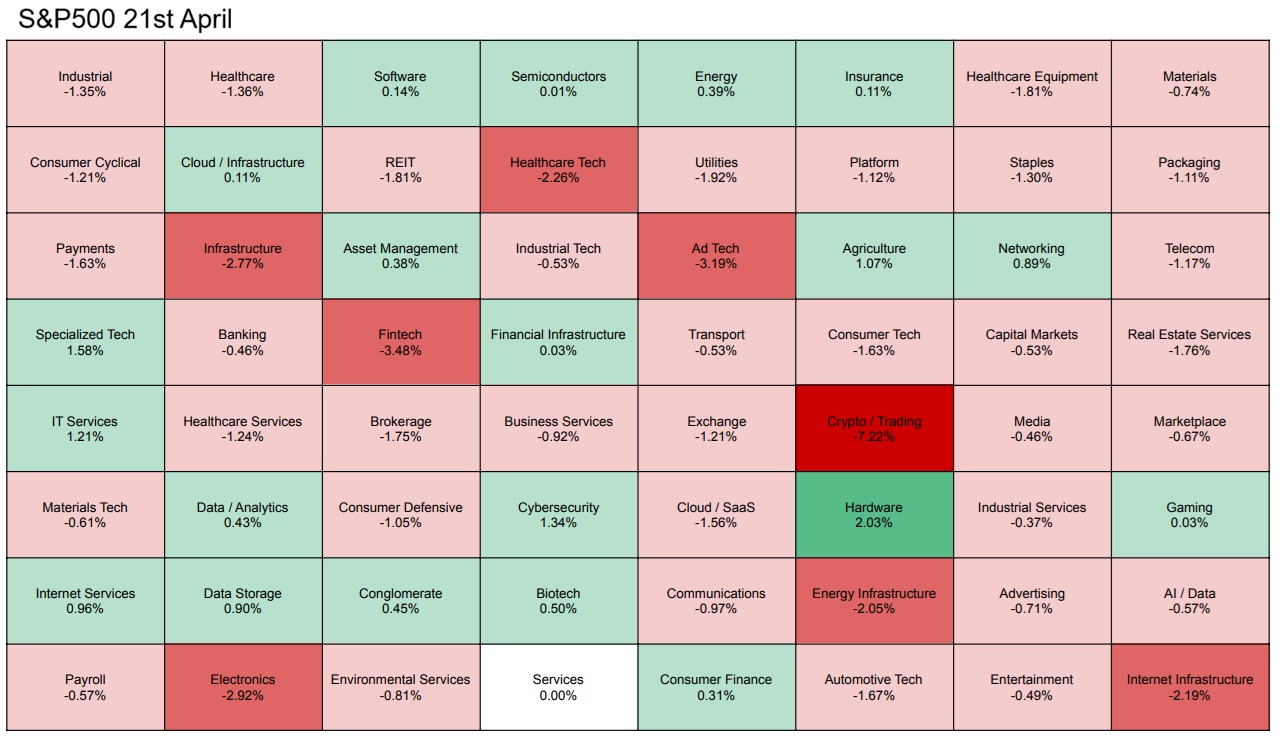 Read more: 21st April: Crypto to Fintech Weakness Signals Broader Market De-Risking
Market internals continue to deteriorate beneath the surface, with sector-level performance pointing to a broad-based de-risking environment rather than a clean rotation. The heatmap shows a clear dominance of negative returns across most sectors, with only isolated pockets of strength failing to establish any meaningful leadership. This lack of cohesion is typically indicative of capital…
- Rummu provides data, analysis, and tools for research purposes only. The information presented does not constitute financial advice, a recommendation, or an offer to buy or sell any securities. It does not take into account individual objectives, financial situations, or needs. You are solely responsible for your own investment decisions.