Financial markets are often described as forward-looking, complex systems driven by earnings, sentiment, and macroeconomic conditions. However, when examining periods of geopolitical stress and economic disruption, a more consistent and observable relationship emerges:
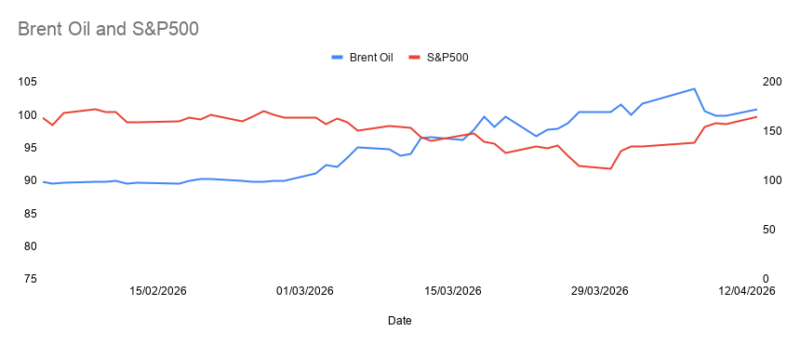
Oil acts as a leading indicator of market stress, while equities respond with a lag.
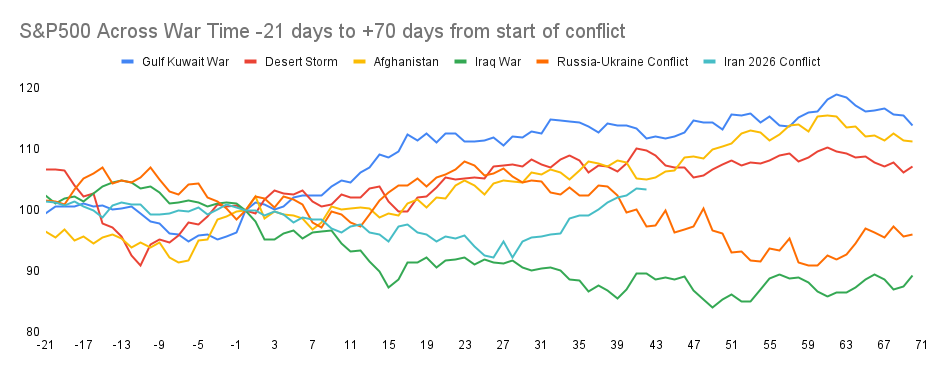
By analysing multiple major events, including the 1989 Exxon Valdez oil shock, 2003 Iraq War, 2020 COVID crisis, and 2022 Russia–Ukraine conflict, a repeatable structural pattern becomes visible across decades of market behaviour.
Here I try to outline that pattern and explain why oil price dynamics provide a powerful framework for understanding market timing, volatility, and recovery.
The Core Relationship: Oil Leads, Markets Follow
Across all examined events, one consistent principle became evident…oil moves first and then equities react. It is not the event itself that causes the biggest disruption in the stock market, its the impact it has on oil price.
Oil reflects immediate changes in supply disruption (wars, sanctions, infrastructure damage), demand shocks (economic shutdowns, recessions) and geopolitical risk premiums.
Equity markets, by contrast, digest information more gradually, price in second-order effects (earnings, inflation, policy response) and exhibit smoother but delayed reactions.
If you are someone into investing in the stock market, it likely does not feel this way. But monitoring key indicators like oil price tells us the potential of what will occur in the markets.
Why?
Because it is a lead-lag dynamic, where oil provides early signals of stress before equities fully adjust.
A Repeatable Four-Phase Market Structure
Across every event studied, markets follow a broadly consistent four-phase cycle, only the timing of the phases differs.
Phase 1 Shock: Oil Moves First
The initial event triggers a rapid move in oil prices. This can be a supply shock where oil spikes, generally seen in war times. Or it can be a demand shock where oil collapses as seen during COVID.
Either way, equities begin to weaken, but typically not as violently as oil.
The key insight is that oil reflects the immediate economic impact before equities fully price it in.
Phase 2 Dislocation: Maximum Volatility
Oil enters a period of extreme volatility with rapid spikes or collapses, including large intraday and short term swings.
This is when equities typically decline further and start to experience increased volatility. It is where we see the market approach, or reach the bottom.
The key knowledge is that markets bottom during peak uncertainty, not after clarity.
This is the moment to be stepping in, when everyone else is stepping out. Prices are dislocated and premium stocks operate at historical low P/E ratios or high yield.
Phase 3 Stabilisation: Turning Point
Oil price behaviour changes with volatility reducing and we start to see price action become range-bound.
Equities begin to stabilise and form a base, showing early signs of recovery.
The key insight is that rate of change matters more than the absolute level. Markets respond when conditions stop worsening.
This is when the market steps in and starts to buy again.
Phase 4 Recovery: Oil Normalises, Markets Rise
Oil trends downward or stabilises further and risk premium fades. Supply and demand balance improves.
Equities recover steadily and reprice growth expectations. This is when the market enters a sustained upwards trend.
The analysis shows that declining or stable oil acts as a tailwind for equities.
Not All Oil Shocks Are Equal
While the structure is consistent, the type of oil movement determines how markets behave. The same four phases still occur, but the shape and duration of each phase changes depending on the nature of the shock.
There are three broad patterns that emerge.
Supply Shock: Fast Spike, Fast Resolution
(e.g. Iraq War, Exxon Valdez)
Oil rises sharply due to sudden supply disruption, but resolves relatively quickly.
Markets react with a short, sharp sell-off as uncertainty spikes. Volatility increases, but does not persist for long. Once oil stabilises, equities recover rapidly.
This typically results in a V-shaped recovery with strong rebounds.
The key takeaway is that the disruption is real, but temporary.
Demand Shock: Collapse and Policy-Driven Recovery
(e.g. COVID 2020)
Oil falls dramatically as demand collapses across the economy.
Markets also fall quickly, but recovery begins before oil fully normalises. This is driven by liquidity, policy response, and forward expectations rather than real economic recovery.
In this scenario, equities lead and oil follows.
The key takeaway is that markets recover on policy and expectations, not current conditions.
Sustained Shock: Prolonged Pressure on Markets
(e.g. Russia–Ukraine 2022)
Oil remains elevated for an extended period, reflecting ongoing supply constraints and geopolitical risk.
Markets struggle in this environment. Inflation remains persistent, earnings expectations become harder to sustain, and valuations compress.
Rather than a sharp recovery, markets move sideways or grind lower over time.
The key takeaway is that duration matters more than the initial move.
Across all three scenarios, one principle remains consistent.
Markets do not bottom when oil is at its highest or lowest point. They bottom when oil stops moving aggressively.
This reinforces the core idea. Markets are not reacting to price levels, they are reacting to uncertainty and rate of change.
Once conditions stabilise, even at elevated levels, equities begin to recover.
Implications for Market Behaviour Today
This framework provides a lens for interpreting current conditions:
Rising oil + high volatility = ongoing stress
Oil stabilising = early signs of a bottom
Oil declining = improving conditions for recovery
Importantly:
The duration of oil disruption determines whether market weakness is temporary or prolonged. This Matters for Investors, because understanding this relationship allows for:
Better Timing of Capital Deployment through avoiding deploying capital aggressively during peak oil volatility and increasing exposure as oil stabilises
Improved Interpretation of Market Moves by separating noise from structural change and recognising when markets are reacting vs. anticipating.
Alignment of macro and micro signals by combining oil behaviour with volatility indicators (e.g. VIX), market internals (buyer/seller dominance) and valuation frameworks.
Across more than three decades of market history, a clear and consistent pattern emerges:
Oil is not just a commodity, it is a real-time signal of macro stress that shapes equity market behaviour.
From geopolitical conflicts to economic crises, the same structure repeats:
- Oil moves first
- Markets follow
- Recovery begins when volatility subsides
By focusing not on price levels but on direction and stability, investors gain a powerful framework for navigating uncertainty.